What is statistical significance?
You may have noticed that we have already been using statistical significance when interpreting the output of linear regression models. However, there is a lot more to understanding the use and potential pitfalls of statistical significance than simply quoting back p-values and stating whether they meet a particular threshold or not. We explore this idea here.
First let's think about what statistical significance really means:
To decide if something is statistically significant, we start with with some threshold that we have chosen in advance, which is just a probability where we decide: if something that is less probable than this happens, we are going to treat it as though this is evidence of an an event or relationship that is probably different from zero. One threshold commonly used in education research is 0.05, or 5%; but in other research, someone might choose a more conservative threshold, like 0.01 or 0.001; and in other research, someone might choose a less conservative threshold, like 0.10. The key point is that these values are supposed to be chosen in advance; otherwise, we can pick and choose where to put our threshold, to make results look significant. In some studies, people will note significance for multiple thresholds (e.g., by using different symbols in a table for significance at the 0.10, 0.05, and 0.01 levels).
How do we calculate the probability used for determining statistical significance? There are actually many different ways that this is done, and usually we let statistical software do it for us. But the basic point is that 1) we have some measure (e.g., a regression coefficient), and 2) we need determine the probability that that measure is different from zero (or from some other value--i.e., that the difference between this value and another is different from zero). In other words, if the "true" value of the coefficient is zero (the regression we would get if we collected data on every single member of the population), what is the probability that our sample (based on some assumptions about our sample, which at a minimum are that it was randomly selected, is of a certain size, and has a certain variation in the variable) will give us a regression coefficient of this size?
This can be hard to tell simply by looking. In some cases, a regression coefficient of 2 may be very, very unlikely if the "true" value is actually zero; in other cases, it may be quite likely (for example, if the regression coefficient is measuring something quite large that varies quite a lot, we can see how 2 would be a tiny difference from zero; on the other hand, if the regression coefficient is measuring something quite small that varies very little, 2 might be quite a large difference from zero). So, we need statistical techniques in order to determine how unlikely that coefficient of 2 really is if the "true" value is zero.
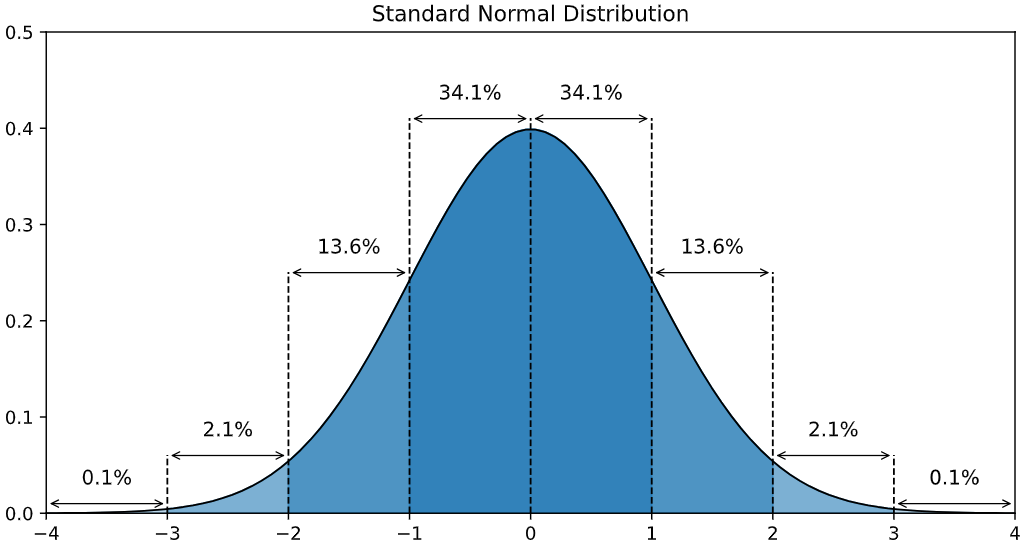
One easily accessible example, that is a simple approach that is also used or expanded upon by a lot of more sophisticated techniques, is to use the standard normal distribution to represent our data. For the standard normal distribution, others have already worked out for us what percentage of values fall into each part of the distribution, so it is easy to look up what the probability of a given value is, if you just know its mean and its variation. We will get to the details of how to do that in a bit. But first, we want to think a bit about why we use the notion of statistical significance in the first place, and what some of the potential pitfalls of using it may be.
One of the most obvious issues with statistical significance, is: Why use a binary designation at all? Why collapse rather nuanced data into a simple yes/no label, related to an arbitrary cutoff?
For example, a measure with a p-value of 0.0505 is not meaningfully different than one with a p-value of 0.495, yet the later result is statistically significant at the 0.05 level, and the former is not. In reporting results like these, it would be important to point that out, and not to simply highlight the statistically significant results.
I will be frank--I typically use statistical significance in my papers. The reality is that in education research, most journals and most reviewers expect it (and I have more than once had a reviewer insist that I add it in to a paper, even in cases where I felt it was inappropriate). You may find that you cannot avoid listing p-values when you report on your research results, and this is not necessarily a problem, as long as you are careful about how you discuss them.
Many scientists have discussed issues with statistical significance as it is currently used. Here is one reading that discusses this in a good amount of detail:
Issues with Statistical Significance
Assignment 2a: Find 1-2 published articles in an area that interests you that uses linear regression and reports on statistical significance by giving the exact p-values for each measure (not just symbols like stars to indicate a particular threshold).
Consider one set of results reported in the study (e.g., one of the tables in which statistical significance is reported). If you can, copy and paste the relevant parts of the study into your Google doc, or include a link to the study as well as the page number for the results you will be discussing. Summarize the results, including describing the statistical significance found in the study. Be sure to put this into your own words and do not just repeat what the authors have already said--try to think about how you would explain this to a peer who does not know a lot about statistics yet.
Then take a second look at the study--were there any p-values that were close to significance but were not significant? What can you say about those values? Describe their relationship to other values in the study that were statistically significant.
For values that were statistically significant, do you think that these differences were meaningful? Why or why not? If you are not sure, describe what other information you would want to know in order to determine if these differences were meaningful.
Before we can delve more deeply in to the idea of statistical significance, we are going to review some ideas that you may have already seen in an introductory statistics course.
Determining statistical significance requires measures of variation in a sample, and precision of statistical estimates based on a particular sample. All of the statistics that we are talking about in this class are about samples. If you recall from a prior statistics course, we are often using statistics to try to say something about a population (e.g., everyone in the US, every 8th grader in the US, every kid in a particular elementary school, etc.). However, we can almost never collect data about every member of a population, so instead we try to get a good sample (e.g., a random sample) that is likely to do a good job of representing the population (e.g., has the same proportions of all the same characteristics that we care about as the population). Then, we do some statistical calculations on the sample, and use this to make claims about the population. However, even if our sample is representative, there are limits to what we can do:
- The size of the sample impacts what we can say. If there are not that many people in the sample, we may not have enough information to be very confident that the particular percentages or means in this sample represent the total population.
- The amount of variation in the sample, or how much the particular thing we are measuring varies, will impact how precise our estimate of the population will be. For example, if the thing that we are trying to vary measures a lot, it will be harder to get a precise estimate of the true population value than if that thing only varies a little bit from one person to the next.
- To use some statistical techniques, we may have to assume that the thing we are trying to measure has a certain distribution, like a bell curve. Many things that we measure do behave this way, and we won't get into details here about what we do when this is not the case. But the idea is that we do often need to use this distribution as a model of the data in order to be able to say things about our estimates.
Using the standard normal distribution, along with information about the variation in the sample and the size of the sample can allow us to say something about how precise our calculations (e.g., means, proportions) on the sample are for estimating the values (e.g., means, proportions) in the population. This leads us to be able to describe both confidence intervals, or ranges that give us a better sense of the precision of our estimates, as well as statistical significance, which tells us something about the likelihood that two values are actually different in the population (and not just in this particular sample).
(We note that all of the information that follows is predicated on the assumption that we have a representative sample. If I choose a "bad" sample, then none of this fancy math will rescue that problem, as I am not truly "sampling" from the population!)
The Standard Normal Distribution
This describes the shape you might get if you graphed all the values for a particular measure in the two-dimensional coordinate plane. You have probably heard of a normal distribution, which is a kind of bell curve. It is used a lot in statistics, because if data has a standard normal distribution, then we can make a lot of assumptions that make it easy for us to calculate stuff like standard errors, what percentage of people or measurements in a population has a particular characteristic, etc. One key thing to note: Not all bell curves are a standard normal distribution--the standard normal distribution is just one particular shape of a bell curve.
Introduction to the standard normal distribution
This reading is an accessible introduction to explain what the standard normal distribution is.
Variation in the Sample: Introduction to Standard Deviation
Standard deviation is one measure of how much data values in a sample vary. This particular measure is used, along with the standard normal distribution, to calculate confidence intervals, as well as to help us determine when values are statistically significantly different from one another (e.g., by using z-tests or t-tests).
Introduction to variance and standard deviation
This reading is an accessible introduction to explain what variance and standard deviation is.
Assignment 2b: Read the attached pdf, and answer the questions here.
This assignment asks you to consider how z-scores may allow us to compare different measures, and what it tells us about the inferences that we can make about individuals vs. larger populations.
"Effect" Sizes and "Real World" Significance
We now return to our idea of statistical significance again. One of the major limitations of measures of statistical significance is that it only gives us a measure of how likely a particular value that is different from zero is likely to have occurred simply by chance. But it does not tell us anything about how meaningful that difference from zero may be. In a study with a very large sample size, almost all differences in values will be statistically significant. This does not mean that they are practically significant.
For example: if I am testing whether my sample is significantly different from the population, and I see that 22.3% of my sample was placed into Algebra I, but 22.7% of the population was placed into algebra I, and these two proportions are significantly different because my population is around 500,000 and my sample is around 20,000 (leading even small differences to be statistically significant), should I conclude that my sample is not representative?
What if I try out a classroom intervention, and the difference in passing rates for the course is highly significantly different (e.g., at the p = 0.001 value), but passing rates only go up from 50.1% to 50.3%. Is that a meaningful increase from the intervention?
How big are each of these differences really?
Or suppose I am a college administrator, and I need to decide which of several interventions to try out (I only have the funds for one of them). One intervention improved college retention from 72% to 78%, and another intervention increased the number of credits that students earned on average from 9.8 per term to 10.4 per term. Both were statistically significant. Neither intervention measured the same outcome variable, so I can't compare them directly, but I care equally about these two outcomes. Which one should I choose? Which one had a stronger effect?
Clearly, just measuring statistical significance alone is not enough. Because of this, we also can measure what are called "effect sizes".
Introduction to "effect" sizes
This reading gives a brief introduction to "effect" sizes. For the most part you can focus your reading here on their descriptions of Cohen's d.
But there is more to making inferences about "effect" sizes than simply using standard deviations (e.g., Cohen's d) as a way to measure them. Talking about how many standard deviations a difference or effect is can be hard to judge or comprehend--how many standard deviations of an "effect" are important? (I have put "effect" here in quotes, because when "effect" sizes are used to talk about differences in observational studies, they are not measuring effects. This is an important distinction to keep in mind.)
Different ways of measuring "effect" sizes
This paper describes in detail some of the different ways that people have used to measure "effect" sizes or to interpret the meaning of "effect" sizes. It also discusses some of the pitfalls in interpreting "effect" sizes.
Assignment 2c: Return to the article(s) that you looked at in 2a.
For the article(s) that you looked at in 2a--did the article include any measures of effect size or not? If not, is there sufficient information for you to calculate an effect size (e.g., mean and standard deviation)? If the article includes an effect size and/or it is possible to calculate one, discuss the effect size and what we might say about the practical size of the "effect" (or if it is an observational rather than causal study, as most are, the correlation) in this study.
Are there other measures of practical importance that would allow us to better interpret how large the "effect" or correlation is? Think about the reading on this topic that discusses many alternative ways of thinking about practical implications. Can you use any of these approaches with the paper(s) results that you have found? Or can you think of others on your own that would be appropriate to this research?
How might you translate the practical significance of this research to practitioners?
Assignment 2d: Return to the linear regression analysis that you did in Assignment 1.
For the analysis that you did in assignment 1 on the dataset that you chose, write up your results again, this time thinking about whether you want to revise any of your statements about statistical significance. Explain any revisions you have made and why you have made them (or if you found revisions to be unnecessary, explain why).
For any results that you found that were not statistically significant, is there anything additional you should say about these results?
Now talk about the "practical" significance of your study. Calculate at least one effect size for one of the point estimates in your linear regression. Discuss any other practical interpretations of your results, using some of the approaches discussed in the readings.
For any statistically significant results that you found, how meaningful are the differences?
How to Calculate and Interpret Confidence Intervals
Confidence intervals are an important tool for interpreting data that tells us something about how precise our estimates from our samples are in representing the population that we are trying to study. This is also related to the calculations we have done with statistical significance and effect sizes above, because it also utilizes measures of standard error and focuses on uncertainty in our estimates.
We can calculate confidence intervals any time we have a point estimate (i.e., a specific value from some statistical model that estimates something, like a mean or a proportion) and a standard error. So, for example, if we have calculated a mean and a standard error, we can use this to produce a confidence interval around that mean, which is a way of describing how precise that mean really is. We can do something similar for a proportion; we need only know the sample size. Or we can do this by running a linear regression model, and then we can use the point estimates and standard errors from that model to calculate the confidence interval of the coefficients from that model.
Introduction to confidence intervals
This reading is an accessible introduction to explain what confidence intervals are, and how to interpret them. It is a good place to start.
How to calculate confidence intervals
This reading explains how to calculate confidence intervals (CIs) in more detail. This is a useful reference if you want to actually be able to calculate confidence intervals, which you may want to do with your data (there is way more detail here than you need--you can just look mainly at the initial examples for now about how to calculate the CI for the mean and proportions--the other information may be helpful to you later if you want to understand how CIs of regression coefficients are calculated (but Stata does this for you).
Interpreting confidence intervals
This reading discusses in further detail how to interpret confidence intervals. This starts to discuss their relationship to p-values, or significance levels. (This reading states that you should prefer CIs over p-values, and that is not necessarily the case, but it does do a good job of explaining some of the relationship.)
When point estimate confidence intervals overlap, but differences in those estimates are still significant
This reading describes how confidence intervals can overlap between two point estimates, but the difference between the point estimates can still be different from zero (this is because what statistical significance tests is not whether the two confidence intervals of the two point estimates overlap or not, but rather whether the confidence interval of the difference between the two means includes zero). This can be important for understanding and interpreting confidence intervals in research.
Assignment 2e: Find 1-2 published articles in an area that interests you that use confidence intervals to report results (these could be given in tables or in graphs).
Consider one set of results reported in the study (e.g., one of the tables or graphs in which confidence intervals are reported). If you can, copy and paste the relevant parts of the study into your Google doc, or include a link to the study as well as the page number for the results you will be discussing. Summarize the results, in particular discussing the inferences you can make from the confidence intervals reported in the study. Be sure to put this into your own words and do not just repeat what the authors have already said--try to think about how you would explain this to a peer who does not know a lot about statistics yet. But, as you do this, also refer back to the readings about common mistakes in interpreting confidence intervals.
Did the authors make any statements about the confidence intervals that appear to be problematic or incorrect? If so, explain what these are and write out a correction for the authors, or write out advice for the authors on how they should correct their paper.
Check also all of your own statements--have you correctly represented the meaning of confidence intervals as discussed in the readings, and avoided the major pitfalls listed there.
Assignment 2f: Return to the dataset that you used in Assignment 1.
For a few of the variables that you used in your analysis, generate confidence intervals for at least two different groups that you were trying to compare on that variable (e.g., CI for mean outcome of interest for men vs. women). You can ask Stata to do this using linear regression, you can calculate it manually; whatever works for you. Here is some information about how to calculate confidence intervals in Stata: https://www.stata.com/manuals/rci.pdf, if that is helpful.
Compare the outcomes from looking a confidence intervals to the outcomes obtained performing statistical tests using linear regression. Compare and contrast the results, thinking about the various pitfalls and issues with interpretation that have been discussed in the various readings that we have done so far.
Assignment 2g: Read the attached pdf, and answer the questions there.
This assignment asks you to weigh the pros/cons of confidence intervals versus tests of statistical significance in a particular real-world example of how research might be reported. |