What is linear regression, and why are we studying it?
Some of you may have studied linear regression extensively. Others may have little prior experience with statistics. In this course, our focus is not on teaching in detail how to execute particular statistical techniques, but rather, what kinds of inferences we can make from statistical data. Linear regression is one of the most fundamental techniques currently used in statistics, and many different types of statistical analysis are applications of, generalizations of, or extensions of linear regression. So for the first part of this class we will focus on linear regression.
Initial Readings on How to Think about Linear Regression
Review of lines, slope, and linear equations
This reading is a basic review of topics you have covered in prior courses that may seem very basic, but are the core components of linear regression. If you find this material too simplistic, it is fine to skim it over quickly. If it has been a while since you have had math, this may be a helpful refresher or core concepts related to linear relationships--understanding these ideas are at the core of understanding linear regression.
Introduction to linear regression
This reading outlines many of the fundamental ideas necessary to understand linear regression. This is an old paper (so there are many updated references not listed here), but the fundamental ideas discussed in this paper remain salient even today. After reading this paper you should have a basic idea of some of the most important assumptions necessary in order to use linear regression, a rough idea of how and why linear regression is modeled the way it is, and some of the factors necessary to keep in mind in order to make proper inferences using linear regression.
Interpreting multivariate regression coefficients
There are many resources on the web which discuss how to do this. I have presented a sample of them here which discuss this at a variety of different levels. Keep reading these (or other references, if you prefer) until you feel confident that you know how to interpret the meaning of multivariate regression coefficients in a variety of different contexts:
This describes basic interpretation of coefficients: https://www.theanalysisfactor.com/interpreting-regression-coefficients/
This describes how to interpret categorical variables (no need to understand how to program categorial variables into statistical software, just how to interpret them--Stata does this automatically): https://www.unifyingdatascience.org/html/interpreting_indicator_vars.html
Some basic descriptions from Stata about how they handle categorical variables (no need to read most of this, but some of the basic information early on is helpful, just through 26.2.5): https://www.stata.com/manuals/u26.pdf
Check your understanding. Ask yourself as you read:
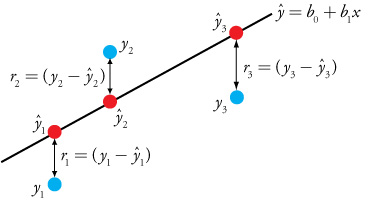
Can you describe what the coefficient represents (hint: it is not the actual change in y with respect to x, but a description of the best fit line--what kind of change does the fit line describe, that is different from the change from one point to another in the data itself?)?
Can you describe what is different about the coefficients in multivariate (more than one independent variable) than univariate (only one independent variable) regression? How does this impact how you should interpret the coefficients when making inferences?
Can you describe what is different about the coefficients for categorical than continuous independent variables (how should you interpret them)?
Our goal here is to think about how to interpret the results of linear regression models, assuming that they have been run correctly. Later we will think more carefully about how to assess whether necessary assumptions have been met in constructing the models, when we try to run our own models.
Assignments based on these Initial Readings (be ready to discuss these at our second class meeting)
For the following assignments, put them into a single Google document that is shared with me (put it into your shared google folder--see main class page for instructions on how to submit assignments).
Assignment 1a: What questions do you have about how to actually use linear regression in a real-life study?
Pick one research question that interests you that you think could be answered with linear regression.
Describe what kind of data you would collect in order to address the research question.
Describe some different analysis steps you would perform on the data in order to answer your research question.
What are some possible outcomes of that analysis? Describe at least three possible ones that could occur.
For each possible outcome, describe what inferences you could or could not make about the research question. Describe the possible limitations or caveats that you would need to discuss in when writing up your results.
After thinking about this, what questions arise for you about how to do linear regression? If you suddenly had to implement this study, what questions would you feel that you need answers to first before conducting the study, analyzing the results, or writing about the inferences that can be made from these results?
Assignment 1b: Try writing up interpretation and inferences from some sample data
Start with the following results of linear regression: click here
Pretend that you are a researcher writing up the results of this study.
Assume that you already ran all the necessary checks before running this analysis, in order to determine that it was appropriate. Describe what the results of this regression tell us about the data, with particular attention paid to the research questions you hope to answer.
Make sure that this is your own work--you can consult examples of discussions sections in papers online, but do not copy directly from any other work, and make sure that all interpretations are in your own words.
Assignment 1c: Find a freely available dataset on the web (or feel free to use any existing data that you may have and are interested in analyzing) that could be analyzed using linear regression
This can be anything you want. It can come from some of the datasets referenced in the readings, as long as the analyses you are intending to run don't immitate exactly what is being done in the examples on those pages. You don't need to analyze it yet. Simply choose one dataset that you think you could work with, where you can envision forming a research question that could be approached using multivariate linear regression (it does not need to be in Stata file form, but it should be in a format that you are able to import into Stata). In your document, include a link to the dataset, and write up a few paragraphs describing:
- Why you have chosen this dataset.
- What the particular variables are in the dataset that your are interested in using in analysis (what do they measure? what units? are they continuous, categorical, binary? what will you use as a reference group and why?)?
- What research question(s) might you be able to answer using these variables and this particular dataset?
Here is a link to some starting places to look, if you are having trouble finding a dataset.
Further Readings on How to Run Linear Regression in Stata
Intro to Running Multivariate Linear Regression in Stata
This reading gives a lot of details on how to get started with linear regression in Stata. You can download the dataset on page 3. For now, you can simply focus on reading approximately pages 3-9 of this reading, in order to get started with running basic linear regression in Stata (although there is a wealth of other information in this reading as well which you may find interesting or useful as you use linear regression). I suggest that you play around with the dataset here and practice running the commands (you can ignore the "xi:" prefix used here and simply type in regression commands of the form "regress y x1 x2 etc, robust", and you will get regression results that work fine in current Stata programs). The goal here is simply to familiarize yourself with how to run basic linear regression models in Stata, but you may also find it a useful reference later.
Intro to Scatterplots and Linear Regression in Stata
This reading gives a very simple introduction to how to do this (ignore the assignments at the end--this is just being included as a reading). You can download the datasets here and play around with them in Stata as you read, to ensure that you understand how to do the various steps included here.
How to tell if Running Linear Regression Models is Appropriate
Before we actually run linear regression models in real life, we have to check that they are appropriate, which we can do through different tests. Some of this is addressed in the first reading above, so you may want to consult that further as well, but this reading gives a more streamlined and simple introduction. (As with the last reading, ignore the assignments at the end--this is just being included as a reading.) Again, you can download the datasets here and play around with them in Stata as you read, to ensure that you understand how to do the various steps included here.
More Detailed Reference on Diagnosing whether Linear Regression is Appropriate
This reading may be useful as a reference if you would like to see additional examples or explanation of any of the key features that should be checked before running linear regression. It is not necessary to read it all the way through--I would suggest only consulting it as necessary.
Assignments: Practice Running Linear Regression in Stata (be ready to discuss these at our third class meeting)
Assignment 1d: Use the dataset from 1c above to run some simple multivariate linear regression
Now that you have read the readings above (or as you go back and forth between the various readings above), try running some simple multiple linear regression analysis in Stata. Do at least one univariate linear regression (one independent variable) and at least one multivariate linear regression (two or more independent variables). Justify your choice of models before running it in Stata. Why did you choose these variables? What relationship did you anticipate they might have before running the regressions? Are there other variables that you think should be included in the model (if so, and they are in the dataset, try including them; if they are not in the dataset, describe what additional dataset you would like to see collected so that you could run the models of interest).
Assignment 1e: Assess whether your linear regression analysis from 1d is appropriate, or whether you need to use a different analysis approach
Now that you have read the readings above (or as you go back and forth between the various readings above), assess the data that you used to run your models in 1d to determine if linear regression is appropriate or not.
If the linear regression that you already ran in 1d was appropriate, provide evidence of why this is the case, describing all the tests that you did as though you were writing up this part of the methods section of a paper on this analysis (justifying why the models you have chosen for your results are appropriate). You may want include graphs or other output necessary to explain what you have done and why it is appropriate (you may be providing more details here than you would see in a journal article, where authors may simply summarize this information without providing extensive detail).
If the models you used in 1d above are not appropriate, state specifically which assumptions have been violated, and determine what possible approaches you could take in order to addresss this. Explore different solutions that the different readings suggest (or feel free to search out other sources for guidance--cite them in your work if you do this). If it is possible to modify your analysis to address the issues that you have encountered, do so, and explain exactly what you have done and why (hint: you may want in some cases to include graphs or other output necessary to explain what you have done and why it is appropriate). Now revise your initial analysis and share the resulting output from the linear regression in Stata.
If your data turns out not to be appropriate for linear regression at all, do some research to explore what some possible alternatives might be. Is there any other way you could talk about your data that might be helpful? If you consult outside sources, cite them. If you are stuck here, try picking a different dataset, and repeat 1c-e.
Assignment 1f: Discuss the inferences that can be made from the results of your models in 1e
Describe briefly in words the general relationships between your independent and dependent variables as revealed by your Stata output in 1d. Pretend you are writing the results section of a paper, and describe what inferences we can make from the model output. If you had to modify your model in 1d, describe how the modified analysis differs from your initial analysis, and how the corrections to the model might shift our interpretation of the regression results (if at all). |