By the end of this lecture, you should be able to use the graph of a function to find limits for a number of different functions, including limits at infinity, and to determine when the limits do not exist (and when they do not exist, to explain why). You should also be able to use limit notation correctly.
Because this lecture focuses on limits, let's review our informal definition of limits from the last lecture:
If f(x) eventually gets closer and closer to a specific value L as x approaches a chosen value c from the right, then we say that the limit of f(x) as x approaches c from the right is L.
If f(x) eventually gets closer and closer to a specific value L as x approaches a chosen value c from the left, then we say that the limit of f(x) as x approaches c from the left is L.
If the limit of f(x) as x approaches c is the same from both the right and the left, then we say that the limit of f(x) as x approaches c is L.
(If f(x) never approaches a specific finite value as x approaches c, then we say that the limit does not exist. If f(x) has different right and left limits, then the two-sided limit (limx→cf(x)) does not exist.)
Notation:
Specifically, we write:
limx→c-f(x) = L to denote "the limit of f(x) as x approaches c from the left is L"
limx→c+f(x) = L to denote "the limit of f(x) as x approaches c from the right is L"
limx→cf(x) = L to denote "the limit of f(x) as x approaches c is L"
Be careful!: The plus or minus sign which appears after the c denotes the direction from which x approaches c - it does NOT mean that c itself is positive or negative (it may be either)!
For example:
limx→-2-f(x) = L means that the limit of f(x) as x approaches -2 from the left is L;
limx→-2+f(x) = L means that the limit of f(x) as x approaches -2 from the right is L;
limx→2-f(x) = L means that the limit of f(x) as x approaches 2 from the left is L; and
limx→2+f(x) = L means that the limit of f(x) as x approaches 2 from the right is L;
This definition is informal because we haven't formally defined what we mean by "approaches" or "eventually gets closer and closer". Once we have developed a more intuitive feel for what limits really are, we will come back and formally define these terms.
The best way for us to better understand what a limit is, is just to jump in and start looking at different functions and discussing what the limit might be for specific x-values for that function. But before we do that, we briefly introduce a definition that we will use in the examples that follow. Throughout this lecture, we will often use the word discontinuity, so we define it (at least informally, for now) here:
A function is continuous in an interval if the graph of that function over that interval can be drawn in one stroke (without lifting your pen from the paper).
A discontinuity on a graph is any point at which the graph is NOT continuous (e.g. a hole, a jump, an asymptote).
There are more formal definitions of continuity, but we use this one for now because it is easy to understand intuitively. Later we will come back and define this concept more formally.
The best way for us to understand what limits really are is to look at a bunch of different examples which exhibit different types of behaviors around x=c for some fixed value c. So, let's jump right in!
In this lecture, we work out each example only by looking at the graph. However, each of these functions can also be expressed algebraically (with an equation) and we can also find the limits of functions algebraically by using this equation to calculate the limit. We will talk about how to do that in the next lecture.
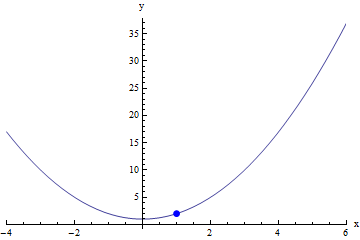
For many straightforward functions, the limit of f(x) at c is the same as the value of f(x) at c. For example, for the function in the graph below, the limit of f(x) at 1 is simply 2, which is what we get if we evaluate the function f at 2. Because the point (1,2) is on the graph of f(x), the limit is is 2, so we could write:
limx→1f(x) = 2

This example wasn't very interesting, because it doesn't really make it clear why we even need to calculate a limit here here: because this function is completely continuous around x=1, the value of the function at 1 and the value that the function approaches as x gets closer to 1 are the same thing!
The limit definition, however, is particularly useful for functions where the function is not defined exactly at x=c (but where it is defined all around c), or where the value of f(x) at c is different from the value that f(x) approaches as x approaches c.
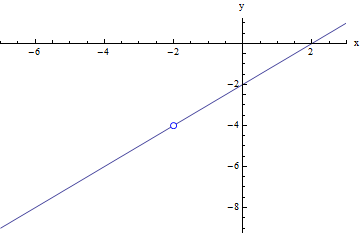
For the function in the graph below, f(x) is not defined when x = -2. Looking at the graph, we can see that there is a hole, or discontinuity, at that point. However, in this case, we can see that as we move along the line representing the function f(x) from the left towards x = -2, the value of f(x) gets closer and closer to -4. Similarly, as we move along the line representing the function f(x) from the right towards x = -2, the value of f(x) gets closer and closer to -4. So in this case, we can conclude that:
limx → -2 f(x) = -4
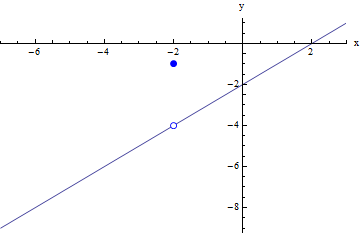
For the function in the graph below, f(x) is defined when x = -2, but the value of f(x) at -2 is not at all similar to the value which f(x) will approach as x gets closer to -2 from either the left or the right. Looking at the graph, we can see that there is a jump discontinuity at that point so that when x = -2, f(x) = -1; however, when x is near (but NOT equal to) -2, f(x) is actually close to -4.
In this case, we can see that as we move along the line representing the function f(x) from the left towards x = -2, the value of f(x) gets closer and closer to -4. Similarly, as we move along the line representing the function f(x) from the right towards x = -2, the value of f(x) gets closer and closer to -4. So even though the function actually equals -1 when we are actually at x = -2, in every other point around x = -2, the function is approaching -4 instead. So in this case, the limit is actually different from the function value at that point:
f(-2) = -1; but
limx → -2 f(x) = -4
For the function in the graph below, f(x) is defined when x = 1, but the value which f(x) will approach as x gets closer to 1 from the left is different from the value that it will approach as x gets closer to 1 from the right. Looking at the graph, we can see that as x approaches 1 from the left, f(x) approaches negative two; however, as x approaches 1 from the right, f(x) approaches positive 2.
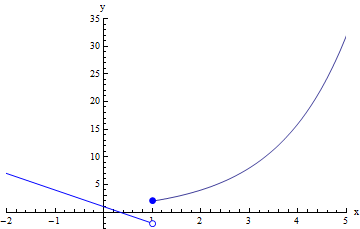
Notice again that the actual value of the function at 1 is not relevant to finding the limit: it is possible that sometimes the limit of f(x) at c will actually be f(c) (as happened in our first example in this lecture), but much of the time, the limit of f(x) at c will be different from the value of f(c), especially when f(c) is not defined, or when there is a discontinuity at x=c.
In this case, limx →1+ f(x) = f(c), but limx →1+ f(x) does not equal f(c). Also, because the limits are different from the left and from the right, the two-sided limit limx →1 f(x) does not exist. Specifically, we can write:
limx →1- f(x) = -2
limx →1+ f(x) = 2
limx →1 f(x) does not exist
For the function in the graph below, f(x) is not defined when x = 0 because as x gets closer and closer to 0 from either side, f(x) just keeps getting bigger and bigger: the closer that x gets to 0, the bigger f(x) gets. At x=0, f(x) doesn't have any specific value on the graph.
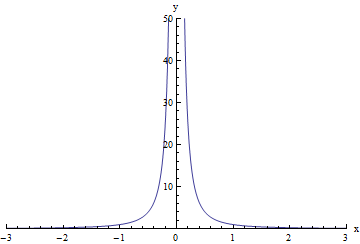
When this happens, we say that f(x) increases without bound as x approaches c. Every time this happens with a limit, we can simply write that the limit does not exist because f(x) does not approach any fixed, finite value as x approaches c. However, that is a little unwieldy to write, so instead mathematicians have invented a bit of shorthand for this:
Notation:
If f(x) increases without bound as x approaches c from the left, we can write:
limx→c-f(x) = ∞ or limx→c-f(x) = +∞
Similarly, if f(x) increases without bound as x approaches c from the right, we can write:
limx→c+f(x) = ∞ or limx→c+f(x) = +∞
If f(x) increases without bound as x approaches c from both the left and the right, we can write:
limx→cf(x) = ∞ or limx→cf(x) = +∞
There is also the possibility that f(x) will decrease without bound (get smaller and smaller, or more and more negative) as x approaches c. In that case, we can use the symbol -∞.
Be careful!: The use of the infinity symbol ∞ is just a shorthand for saying that the limit does NOT exist because it increases or decreases without bound.
But infinity, or the symbol ∞, is NOT a number, and so no equation or function can ever actually be equal to infinity!
We must be very careful how we use the infinity symbol: we can say that a limit is equal to infinity to indicate that the behavior of the function as x approaches c "blows up" indefinitely, but we can NEVER say that f(x) itself is equal to infinity, because no function can ever reach a value of infinity: at every single point on the graph of f(x), f(x) has a specific value, even if that value is very very large (or very very small). (Even if f is undefined at a specific point, it is not equal to infinity at that point - if it is undefined, then it is not equal to anything at that point.)
So, returning now to our example, we can write:

limx →0- f(x) = + ∞
(or, the left-sided limit does not exist because f(x) increases without bound)
limx →0+ f(x) = + ∞
(or, the right-sided limit does not exist because f(x) increases without bound)
limx →0f(x)= + ∞
(or, the tow-sided limit does not exist because f(x) increases without bound)
For the function in the graph below, f(x) is not defined when x = 1 because as x gets closer and closer to 1 from the right, f(x) just keeps getting bigger and bigger: the closer that x gets to 1 from the right, the bigger f(x) gets. And as x gets closer and closer to 1 from the left, f(x) just keeps getting smaller and smaller (or more and more negative): the closer that x gets to 1 from the left, the smaller (or more negative) f(x) gets.
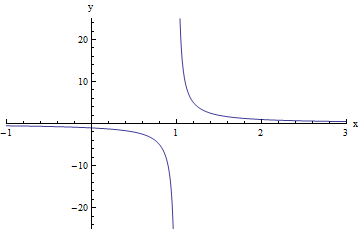
So at x=1, f(x) doesn't have any specific value on the graph.
So in this case we can write:
limx →1- f(x) = - ∞
(or, the left-sided limit does not exist because f(x) decreases without bound)
limx →1+ f(x) = + ∞
(or, the right-sided limit does not exist because f(x) increases without bound)
limx →1f(x)= ∞
(or, the two-sided limit does not exist because f(x) decreases/increases without bound)
We've now seen two examples where f(x) has increased (or decreased) without bound as x approached a specific value c, but the opposite type of behavior can also occur: We can consider what the behavior is of f(x) when x increases (or decreases) without bound. In some cases, it may happen that as x gets bigger and bigger, f(x) gets closer and closer to a specific value L, and in those cases, we could write something like this:
limx →+ ∞ f(x)= L
Similarly, we could consider what the behavior is of f(x) when x decreases without bound, and if f(x) were to approach a specific value L, we could write something like this:
limx → - ∞ f(x)= L
Now we move on to some examples where we consider the behavior of f(x) as x increases or decreases without bound. In other words, we try to determine if f(x) approaches a specific fixed finite value as we go farther and farther to the right, or the left, on the graph of f(x).
For the function in the graph below, we first consider the behavior of f(x) as as x increases without bound, or in other words, we consider what happens to f(x) as we move farther and farther to the right on the graph. In this case, f(x) appears to get closer and closer to zero. It can never reach zero, because the function has no end: x can continue to increase forever. But the behavior of the function as x increases is that it grows ever closer to 0, even if it can never reach it.
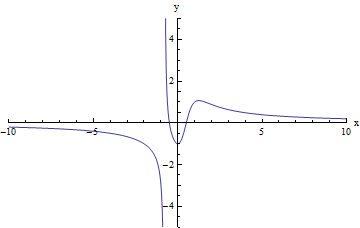
Similarly, as x decreases without bound, or as we move farther and farther to the left on the graph, f(x) appears to get closer and closer to zero. Again, here the behavior of f(x) as x decreases (or grows more and more negative) is that it grows ever closer to 0, even if it can never reach it.
So in this case we can write:
limx → +∞f(x) = 0
limx → - ∞f(x) = 0
For the function in the graph below, we first consider the behavior of f(x) as as x increases without bound, or in other words, we consider what happens to f(x) as we move farther and farther to the right on the graph. In this case, f(x) appears to get closer and closer to two. It can never reach two, because the function has no end: x can continue to increase forever. But the behavior of the function as x increases is that it grows ever closer to 2, even if it can never reach it.
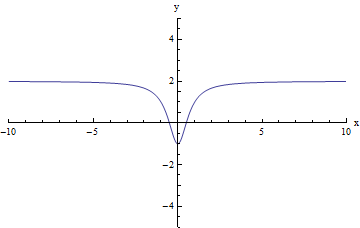
Similarly, as x decreases without bound, or as we move farther and farther to the left on the graph, f(x) appears to get closer and closer to two. Again, here the behavior of f(x) as x decreases (or grows more and more negative) is that it grows ever closer to 2, even if it can never reach it.
So in this case we can write:
limx → +∞f(x) = 2
limx → - ∞f(x) = 2
For the function in the graph below, we first consider the behavior of f(x) as as x increases without bound, or in other words, we consider what happens to f(x) as we move farther and farther to the right on the graph. In this case, f(x) appears to increase without bound: it just seems to get bigger and bigger as we move to the right on the graph, without ever approaching a specific y-value.
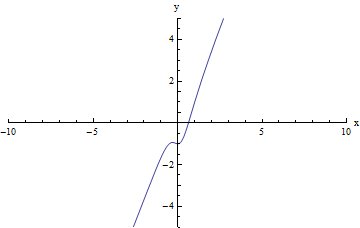
Similarly, as x decreases without bound, or as we move farther and farther to the left on the graph, f(x) appears to decrease without bound: it just seems to get smaller and smaller (or more and more negative) as we move to the left on the graph.
So in this case we can write:
limx → +∞f(x) = + ∞
(or, the limit does not exist because f(x) increases without bound)
limx → - ∞f(x) = - ∞
(or, the limit does not exist because f(x) decreases without bound)
We note that it need not be the case that f(x) increases without bound as x increases without bound and that f(x) decreases without bound as x decreases without bound. For example, for the function in the graph below, we would have the opposite:
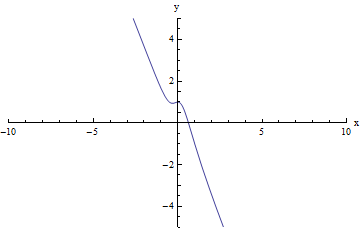
limx → +∞f(x) = - ∞
(or, the limit does not exist because f(x) decreases without bound)
limx → - ∞f(x) = + ∞
(or, the limit does not exist because f(x) increases without bound)
It is also possible for a function to have limits at positive infinity and at negative infinity that are different (or even for the limit to exist for one of these, but not for the other). All this statement really means is that the behavior of f(x) could be very different on the far left of our graph than on the far right. For example, in the graph below, we can see that a limit does exist both as x decreases without bound and as x increases without bound, and that this limit is different in each case:
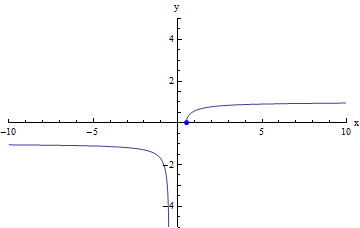
limx → +∞f(x) = 1
limx → - ∞f(x) = -1
There is no reason why our limit would need to be negative as x becomes "more negative" (i.e. as x → - ∞) or that it would need to be positive as x becomes "more positive" (i.e. as x → + ∞). For example, we could have the opposite case, as we do in the function given in the following graph:
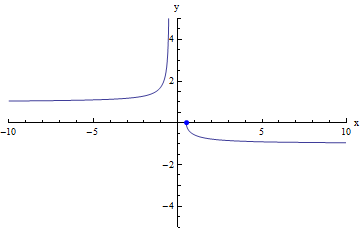
limx → +∞f(x) = -1
limx → - ∞f(x) = 1
One final possibility when we look for a limit as x approaches c is that f(x) never approaches anything as x gets closer and closer to c: we could have behavior, like in the graph given below, where f(x) just oscillates more and more wildly as x gets closer and closer to c from either the left or the right.
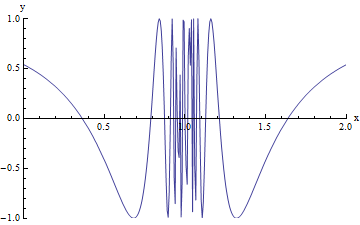
With the picture of the graph above, it's hard to be sure exactly what is happening as x gets closer and closer to 1: it looks like the oscillations are getting more and more dense, so that f(x) is continuously moving back and forth between -1 and 1 without ever settling down, but it is impossible to be sure. (Without an actual equation to look at that would explain exactly what the values of f(x) are as we get closer to 1, we actually can't prove that this is the behavior of this particular function, so for now, I'll just ask you to take my word for it.) But to get a better idea of how this behavior of f(x) really works as x approaches 1, you can experiment a bit with the interactive animation below.
In the interactive animation below, you can see this behavior more clearly by moving the slider to the right, which zooms in the x-values on the graph around one. We can see that as we zoom in around one, the graph just oscillates more and more frequently, until it is so dense that we can no longer see the spaces between the graph and the blank space around it.
In this particular case, the only conclusion that we can make (assuming that you are convinced that this function has the behavior that I have described so far in words), is that the limit of f(x) at x=c does not exist. In this case, the only thing that we can write is simply that:
limx → 1 f(x) does not exist
In this case, we can NOT write that the limit is equal to infinity, because the behavior of f(x) as x approaches 1 is NOT that it increases without bound - rather, the behavior of f(x) as x approaches 1 is to oscillate indefinitely among -1, 1, and all the numbers that fall in between.
This is important, because it is essential for us to understand that limits may fail to exist for different reasons. We can only write limx→c f(x) = ± ∞ in cases where the limit fails to exist because f(x) increases or decreases without bound, and NOT in cases where f(x) has different values on the left and on the right, NOR in cases where f(x) oscillates indefinitely among a set of values as x approaches c.
So far, we have discussed all the ways in which we can find limits graphically, by considering the graph of a function visually. In the next lecture, we will give equations for each of the functions presented in this lecture, and we will explore how we can find limits of functions algebraically (even if we can't look at the graph).
But before we end this lecture, let's take a moment to think about the basic patterns and structure we observed by looking at this collection of different functions with very different types of behavior around x=c.
One of the most important skills in mathematics is the ability to recognize patterns and to be able to categorize expressions, equations, or other mathematical objects based on their properties.
Mathematics is about looking for structure (categorizing equations, expressions or other objects based on common properties)!
For example, when we do homework problems, we may work out 30 different problems, but usually many of the problems have the same structure, even if they have different numbers or variables. Often those 30 problems could really be categorized into something like five different types of problems. If we can see that, then we can make our lives a whole lot easier, because now instead of trying to do 30 problems, we simply need to understand the approach needed to solve problems of each of the five types.
Here is an example of a problem that many algebra students struggle with, usually because they get distracted by details and variables and forget to look for the underlying structure of the equation:
Solve for h: A = 2Πrh + 2Πr2
When aiming to solve this problem, many students get distracted by the fact that the equation contains a lot of variables, and a square, and the irrational number pi. However, none of these details are really relevant to the structure of the equation. This equation really just has the following structure:
A = Bh + C
where B and C just stand in for "some expression that doesn't contain any h's". In other words, we don't really care how many odd or interesting algebraic expressions are written in the place where 2Πr appears in the original equation - instead we can simply think of this whole expression as just the coefficient of h. All we care about here is that in order to solve for h, we need to be able to get h by itself on one side, and so we need to subtract any expression on the right that does not contain h from both sides, so that we can eliminate it on the right side of the equation. And then once we've done that, we will need to divide both sides of the equation by anything that is a coefficient of h.
But all of the following examples have the same structure as the original problem above:
Solve for h: A = 2Πrh + 2Πr2
Solve for h: A = Bh + C
Solve for h: 42.6578 = 94h + 0.55
Solve for h: (Πr2A)2 = Πr6A7 + (2Πr+ 2Πr2)h
Solve for h: 1 = 2h + 3
Solve for h: 1 = (3+4r) + 2h
Each of these examples says that some quantity is equal to some other quantity times h, plus another quantity. So to solve each of these equations, we will just need to subtract the term which does not contain h from the both sides of the equation (to cancel it out to zero on the right-hand side), and then we will need to divide both sides by the full coefficient of h (i.e. whatever is being multiplied by h, however messy and complicated it may be).
So, how does this help us to better understand what is going on in calculus (or other math classes that are not algebra)? In this case, it makes sense to think back about all the limit examples we have just looked at in this lecture. Why did I choose the exact examples that were covered in this lecture? I didn't pick them at random. I specifically selected them so as to cover every possible kind of behavior that we might observe around x=c, so as to give you a good feel for all of the things that can happen when we are trying to evaluate a limit. So let's go back over the examples that we just covered in this lecture, and see if we can look for underlying structure and patterns.


For limits at infinity (i.e. as x approaches ±∞), the situation is less complicated. There are essentially two possible cases:
As we move forward into the next lecture, where we will aim to find rules and procedures for calculating limits algebraically (i.e. using just the equation for f(x) instead of the graph), we will want to keep this list of the possible types of limit behavior in mind! This will help us to figure out how many different types of algebraic techniques we may need to use in order to evaluate limits - if two different functions have different types of behavior around x=c, then we may have to use two different methods to finding the limit for each function algebraically!