By the end of this lecture, you should be able to use the equation of a function to find limits for a number of different functions, including limits at infinity, and to determine when the limits do not exist (and when they do not exist, to explain why). You should also be able to use limit notation correctly.
Just as with the last lecture, we are going to jump right into finding limits of specific functions. But this time we are going to give an equation for each function whose graph we saw in the last lecture, and discuss how to find the limits algebraically (i.e. by doing calculations with the equation for f(x) instead of by looking at the graph of f(x)).
Before we start trying to find limits algebraically, we should start by thinking about what we learned by looking at limits graphically. It is really important for us to understand where algebraic rules come from, and often the best way to do this is to think about the rules graphically, and then to try to translate that geometric image into algebraic symbols. If you can go back and forth between graphical and algebraic representations of functions or other mathematical objects as you solve problems, you will likely be able to do very well in any mathematics course that you take.
Don't use a rule unless you understand where it comes from!
If you don't understand where a rule comes from, there is a really good chance that you will use it incorrectly, at least some of the time. Plus, you have all the extra work of having to memorize something that doesn't make sense. Whereas if you understand where a rule comes from, it is usually much easier to remember, and if you forget the rule, you can usually come up with it on your own.
For example, a lot of algebra students mess up the rules about how to simplify expressions that have exponents, like these two expressions:
a2a3
(a2)3
You may remember the two rules that apply to these expressions: One rule that says that in the case of a2a3, you should add the exponents (to get a2a3= a5), but that for (a2)3, you should multiply the exponents instead of adding them (to get (a2)3= a6). If all you know are these rules, and you don't know where they come from, then you will probably find it hard to remember in which case you should multiply and in which case you should add. At some point you will probably forget which to do in which situation, and then you will switch the rules and get the problem wrong.
However, if you understand the definition of exponents and use that to derive the rules yourself, you will never make this mistake. For example, you could note that a2a3 really just means that you multiply two a's together and then you multiply that by another three a's - so you are multiplying a total of five a's together overall. So it makes sense in that case to add the exponents because each exponent just tells you how many a's are being multiplied, and then all the a's are multiplied together. In the second case, you could note that (a2)3 means that you multiply two a's together three times, for a total of six a's being multiplied together overall. So in this case it makes sense to multiply the exponents, because you are literally taking two a's three times.
We can extend this idea to any area of math. For this section on limits, for example, we will have to come up with several different techniques to calculate several different types of limit problems (since no one rule will work for all problems). However rather than memorizing the rule for each type of limit problem, try to understand the rule by thinking about what the definition of the limit means. Some memorization is good, but you should always be able to explain the rules or concepts that you have memorized. Memorizing something that you don't understand is usually just a recipe for disaster.
Algebraic rules (i.e. ones that deal with expressions or equations) can often be best understood by thinking about the problem graphically.
Sometimes the best way to understand how or why something works is to visualize it graphically. Many mathematicians work this way: if a mathematician wants to prove something, they may find that it is much easier to see a pattern or relationship on a graph of some kind. So they may start with an algebraic expression, then come up with a way to represent that expression graphically, then find the pattern or relationship that they are interested in by looking at the graph, and then they work to translate the pattern or relationship (and the justification for it) into algebra so that they can share it in a formal way with other mathematicians. That is similar to the approach that we will take when solving many calculus problems.
For example, you may remember the Pythagorean theorem: a2+b2=c2 for any right triangle where a and b are the two sides and c is the hypotenuse. Take a look at the following animation which shows a graphical way of showing that this statement is true. (Right clicking the animation will allow you to replay it or to go back.)
You will notice that this animation shows two things:
- It shows how the relationship between a, b, and c, and the relationship between them, can be represented graphically.
- It shows how each step of that proof can also be translated into algebraic equations using the symbols a, b, and c.
This is important: both the graphical images and the equations are necessary for us to fully understand and communicate the proof. And we must be able to go back and forth between the graph/picture and the equations in order to understand the whole proof. This is generally true in many math problems, and it will be particularly true in this class. If you are not yet accustomed to thinking back and forth between graphical and algebraic representations of functions and other mathematical objects, then this would be a good skill for you to start practicing now!
As we proceed to work on limit problems in this lecture, here is what we will do in each problem: We will start by thinking about what the graph looked like, and we will consider how the important features of the graph could be represented by certain characteristics of the equation. Then we will use these characteristics of the equation (as a proxy for the key features of the graph) to help us determine what steps to take in order to determine the limit behavior. See if you can observe this pattern as we work through the following examples.
We are almost ready to jump in and solve our first limit problems algebraically - but before we start with the algebraic limit examples, we need to clarify the use of some specific notation, because we will need this notation in order to correctly write calculations in the examples that follow:
Equals signs are used to indicate that one number (or an expression that represents a specific number when different values for the variable(s) are substituted into an expression) is equal to another number. The equals sign is only used with algebraic expressions which represent specific numbers (or in other areas of math where someone first defines what "a=b" means, but that isn't relevant to our work in calculus or algebra at the moment).
However, with limits we are interested in the behavior of f(x) when x is close to c, but NOT what happens exactly at x=c. So in cases where we want to describe this behavior, we cannot use the equals sign. For example, while we may write:
limx→cf(x) = L to mean that "the limit of f(x) is L as x approaches c", we would have to write:
f(x) → L as x → c (with NO equals sign) to show that f(x) approaches L as x approaches c
This is because f(x) never actually equals L: We may say that the limit of f(x) equals L, but f(x) approaches L indefinitely while never actually reaching it (because x never actually reaches c when we evaluate the limit).
So, any time we use notation that indicates that we are looking at limit behavior (i.e. when x is close to c but not actually equal to c), we must use the arrow sign → instead of the equals sign =.
Every time you are about to write down an equals sign in this course, first ask yourself, "Are these two quantities actually equal?"!
Now we are all set to get started with our limit calculations!
For each of the following examples, we give the equation for f(x). We also include the graph from the previous lecture; however, the graph is not necessary for the calculation of the limit, as we will see, and all the limits below could be computed solely from the information given in the equation for f(x). We leave the graphs here to help us remember how characteristics of the function formula connect with key features of the graph. Obviously, if we do things correctly, we should get the same answer for the limit of a particular function whether we find it graphically (by looking at the picture) or algebraically (by using the equation).
Finding limits using equations allows us to be more precise and rigorous, whereas finding limits using graphs allows us to have a better intuitive understanding of what the function is actually doing around x=c. This principle is true more generally in mathematics: looking at a graph is often the easiest way to see patterns and other connections that will lead us to a solution to a problem or to an argument for a proof of a theorem, however, to actually justify the intuition we get from looking at a graph, we often have to translate that thinking into equations and then use algebra to illustrate the patterns that we saw graphically.
Find the limit of f(x) as x approaches 1:
![]()
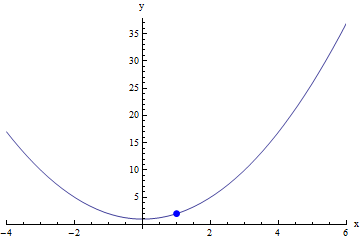
To see if the limit exists at x=1, we have to consider the behavior of the function around x=1 (NOT at x=1). So the most important question that we must ask when looking at this equation is "What will the graph be like around x=1?". In this case, because f is a simple polynomial, we know that the graph will be continuous, with no holes or breaks - in fact, it will be a parabola. But in particular, we should think about what happens as x approaches 1 from both the left and the right.
Since we are working algebraically here with equations, we want a way to write out this idea of substituting values which are close to but not equal to one, into the equation for f. So we need some way to write down symbols for values that are arbitrarily close to one, but not actually equal to one. In order to do this, we break for a moment to introduce a new bit of notation:
We have already seen this notation inside a limit expression, for example, like this:
We are also going to use it in a related but slightly different way when solving limit problems algebraically:
When we substitute the notation c- into an expression, we will use it to denote a value that is arbitrarily close to c, but less than c. Similarly, when we substitute the notation c+ into an expression, we will use it to denote a value that is arbitrarily close to c, but greater than c.
It is important to note that c- (and c+) does NOT have an exact value - it is NOT a number - rather it is a way of describing the behavior of the function around c (but NOT at c). So, for example, if c- appears twice in an expression, it may not indicate the "same" value which is "just to the left of c".
For example, we might write:
(1-)2 → 1-
In this case, the 1- to the left of the arrow is NOT the same as the 1- to the right of the arrow: If 1- was denoting a single specific number, then the 1- to the left of the arrow would be larger than the 1- to the right of the arrow (since squaring a number that is just a little bit less than one yields an answer that is smaller than what you started with). However, we aren't really using 1- to denote a single specific number.
Rather, the correct way to interpret this expression is to understand it as a description of general behavior around 1: This expression is simply stating that if you square any arbitrary number that is "very close to but just smaller than 1", then you will get as your answer a (different) number that is "very close to but just smaller than 1".
Be careful! Because c- (or c+) is NOT a specific number but rather the description of behavior around c, as soon as we substitute it into an expression we must use the → sign and NOT the = sign! So, while I can write (1)2 = 1, I must write (1-)2 → 1-.
And now back to our example: If we think about the behavior around x=1, we can see that when x approaches 1 from the left, f(x) will approach 2 from below because:
(1-)2 + 1 → 1-+ 1 → 2-
(because something slightly less than one, when squared, will be something a bit less than one; and something a bit less than one, plus one, will be something just a little bit less than two).
Similarly, when x approaches 1 from the right, f(x) will approach 2 from above because:
(1+)2 + 1 → 1++ 1 → 2+.
So if we were to write out all the steps, we would have:
![]()
![]()


![]()
Because f(x) is continuous in some open interval around x=1, the behavior of f(x) as x approaches 1 from both the right and the left is the same. In such a case, we can simply plug in 1 for x into f(x), and the value of f(1) will be the same as the limit of f(x) at x=1.
Note: We are again being a bit informal here. To make this a proper theorem, we would need to prove that any time f(x) is continuous in any interval right around c that the limit of f(x) as x approaches c is equal to f(c). Since we don't yet have a formal definition of the limit, we can't do this properly using rigorous mathematics, but we can make an informal proof of why this is correct that should help us to understand why this is true:
Informal proof: If f(x) is continuous in some interval around x=c, then by the definition of continuity, we should be able to put our pen down on the graph of f(x) somewhere to the right of x=c and trace the graph (without picking up our pen) until we hit the point (c, f(c)). We know that the point (c, f(c)) must exist, because if it didn't f(x) would not be defined at x=c and therefore f(x) would not be continuous at x=c, which would contradict our premise that f(x) is continuous around x=c. So by definition, f(x) gets closer and closer to f(c) as x approaches c from the right, and therefore the limit of f(x) as x approaches c from the right is f(c). Using similar reasoning, we can conclude that the limit of f(x) as x approaches c from the left is also f(c). So by definition, the two-sided limit of f(x) as x approaches c is also f(c).
Notice, that in thinking through this proof, we are using a mental picture of the graph to prove our point. We think about what it means for something to be continuous by thinking about what the graph would look like around the limit. This proof would be much harder to write out if we did not think about the problem graphically!
So, we could propose the following informal theorem:
Theorem: When f(x) is continuous in some open interval around x=c, then:
limx→c f(x) = f(c)
This is just a simple way of saying that if we can find an interval around x=c where f(x) is continuous, then the limit of f(x) at c is just the same as the value of f(x) at x=c.
We haven't proved this theorem formally yet, but once we have a formal definition of the limit, we will be able to prove it formally.
Find the limit of f(x) as x approaches -2:
![]()
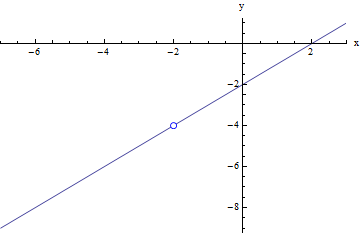
For this function, f(x) is not defined when x = -2, so we will encounter a problem if we just substitute -2 directly in for x in the equation for f. If we try to compute f(-2), we get the undefined expression ![]() .
.
So in order to find this limit, we need to think about ways that we can rewrite f(x), so that we don't get something that is undefined when we plug in -2 for x. We will need to remember our algebra in order to do this. This is going to be a recurring theme throughout calculus.
So here is our goal: we need to replace f(x) with an equivalent function that is the same as f(x) everywhere around x=c. This means that it must be the same as f(x) everywhere except (possibly) at x=c. (Because we are trying to find the limit, and the limit is only focused on the behavior around x=c, and not at x=c, it doesn't matter whether the functions agree exactly at x=c.)
In this case, when we plug in -2 for x, we get ![]() . So a good first step would be for us to identify if there is a way we could rewrite this function so that when we plug in -2 for x, either the top or the bottom of the fraction will no longer be zero. And because f(x) is a rational function, one of the first things we may think to try is to factor the top and the bottom of the fraction, and then see if we can cancel a common factor, because this might help us to get rid of one of the zeros at the top or the bottom of the fraction, which would allow us to calculate the limit.
. So a good first step would be for us to identify if there is a way we could rewrite this function so that when we plug in -2 for x, either the top or the bottom of the fraction will no longer be zero. And because f(x) is a rational function, one of the first things we may think to try is to factor the top and the bottom of the fraction, and then see if we can cancel a common factor, because this might help us to get rid of one of the zeros at the top or the bottom of the fraction, which would allow us to calculate the limit.
![]()
![]()


But how can we relate this algebra back to the graphical picture of what we are doing? If we recall, the graph of f(x) was a line with a hole in it at x = -2:

So when we replaced f(x) with x -2, what were we actually doing? We were replacing f(x), which is a line with a hole at x = -2, with y = x -2, which is the exact same line without the hole. The two functions are not completely identical, but they identical everywhere except at x = -2, which is all that matters when we are calculating the limit. In order for two functions to have the same limit at x = -2, all we need is for them to be identical in some interval around x = -2 (but NOT necessarily at x = -2).
For this function, f(x) is defined differently when x = -2, versus when x ≠2, and as a result, the equation for f(x) that we would use to evaluate f(x) at c is different from the equation that we would use to determine the limit of f(x) as x approaches c.
Find the limit of f(x) as x approaches -2:
![]()
![]()
Again, we want to relate this algebra back to the graphical picture of what we are doing. Looking back, the graph of f(x) was a line with a hole in it at x = -2, plus another extra point when x = -2 which is unrelated to the graph of the line:
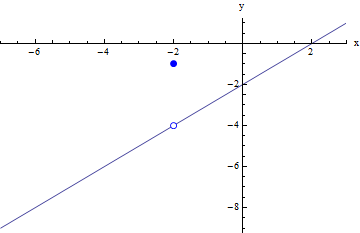
Just like with the last problem, we are able to replace f(x), which is a line with a hole at x = -2 and then an "unconnected" point at x = -2, with y = x -2, which is the exact same line without the hole and the "unconnected" point. The two functions are not completely identical, but they identical everywhere except at x = -2, which is all that matters when we are calculating the limit. Again, in order for two functions to have the same limit at x = -2, all we need is for them to be identical in some interval around x = -2 (but NOT necessarily at x = -2).
For this function, f(x) is described by a different equation to the left of c than to the right of c, so we will need to use different equations to calculate the left-sided versus right-sided limits.
Find the limit of f(x) as x approaches 1:
![]()
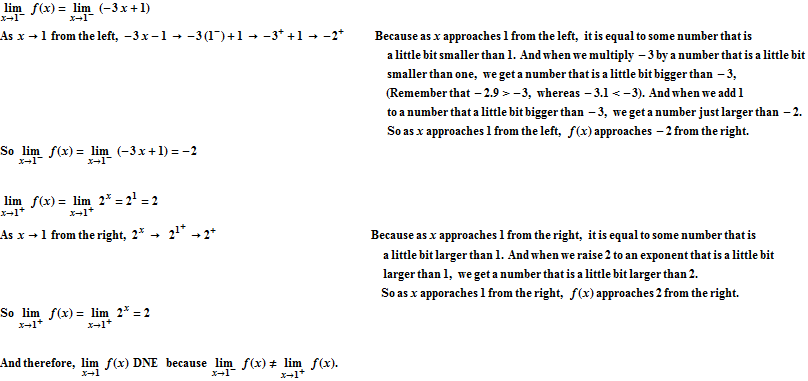
Once again, we should try to remind ourself how our algebra related to the graph. The graph of f(x) was a composite set of two functions, with a jump at x=1. So it makes sense that to find the right-handed limit we must look at the function that applies only when x≥1, and to find the left-handed limit we must look at the function that applies only when x<1. If these two one-sided limits are not the same, then the two-sided limit will not exist, and this is what we expect from the graph since the two function do not joint up in any way at x=1.
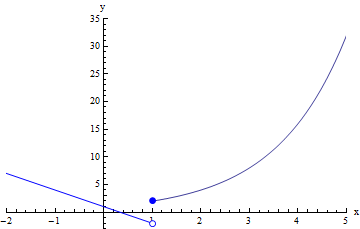
In these examples so far, we've seen how we need to think about what the equation for a function tells us about the graph of the function in order to determine what we should do algebraically to find the limit.
We've also seen how we can solve limit problems by finding a way to substitute c directly in for x: in order to do this, we often have to rewrite f(x) by replacing it with an equivalent function that is the same around x=c, and we need to recognize when plugging c directly in for x gives us a value that is indeterminate. We saw in the examples here that sometimes plugging c directly in for x gives us the undefined value ![]() , and this was a clue that we needed to find a way to rewrite f(x) that would not give us this undefined expression. However, when working with limits, we need to take the idea of undefined expressions even further, so that we can understand a bit better which undefined expressions are really a problem when we are trying to find limits, and which are not a problem in the context of limits. The next lecture will focus on this distinction, and by understanding that distinction, we will be able to calculate a much wider variety of limits.
, and this was a clue that we needed to find a way to rewrite f(x) that would not give us this undefined expression. However, when working with limits, we need to take the idea of undefined expressions even further, so that we can understand a bit better which undefined expressions are really a problem when we are trying to find limits, and which are not a problem in the context of limits. The next lecture will focus on this distinction, and by understanding that distinction, we will be able to calculate a much wider variety of limits.