What is the domain (and range) of the function? Are there any holes, and if so where are they?
We can use our algebra skills to find the domain (and range if we wish). The most important step is to find the domain. To do this we only need to ask ourselves, "Are there any values of x for which the function f(x) will be undefined over the real numbers? The two major cases in which this tends to happen most often is when an x-value would give us 0/0 or a negative number under an even radical (like a square root). But it can also happen in other cases, such as when x is Π/2 in f(x) = tan x, or when x is zero in f(x) = log x (since no power can equal zero unless the base is zero). We can tell if a discontinuity is a hole if it is removable (or if simplifying the function would cause it to go away).
Where does the curve cross the x- and y-axis?
We already know how to do this from algebra: to find the x-intercept (where the curve crosses the x-axis), we simply plug in zero for y and solve for x, since y=0 on the x-axis. Similarly, to find the y-intercept, we simply plug in zero for x and solve for y.
Does the curve have any asymptotes (horizontal, vertical, slant)? If so, where are they?
We break this question up into the three types of asymptotes:
-
vertical asymptotes: To find vertical asymptotes, we simply need to look for discontinuities in f(x) that are not removable. This is something we have already practiced.
-
horizontal asymptotes: To find horizontal asymptotes, we simply need to compute the limit of f(x) as x → ∞, and then again as x → -∞. If either limit exists, then there is a horizontal asymptote there, as we have seen in the previous lectures on finding limits.
-
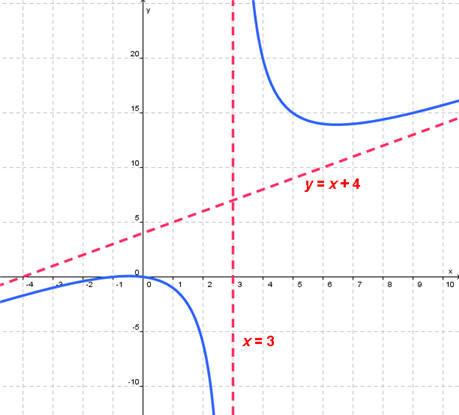
slant asymptotes: A slant asymptote is similar to a horizontal asymptote, except that as x → ∞, or as x → -∞, the y-values approach a line with a non-zero slope, instead of a fixed value (or a horizontal line). For example, in the graph below, as x → ∞ and as x → -∞, f(x) approaches the line y = x + 4. This happens because the limit of f(x) as x → ∞, and as x → -∞ actually approaches x + 4. There are a number of different ways to calculate slant asymptotes, but the simplest example is when we have a rational function (which is a fraction with two polynomials, one in the top and one in the bottom). When f(x) is a rational function, we can find out if f(x) has a slant asymptote by simply dividing the top of the fraction by the bottom, using division of polynomials which we learned in precalculus/algebra. If f(x) can then be rewritten in the form f(x) = mx + b + (a proper fraction where the degree of x in the top is smaller than the degree of x in the bottom), then we have a slant asymptote of the form y = mx + b. To see examples of how to calculate slant asymptotes, click here.
Where does the curve have local maximums or minimums (or in other words, where is it increasing, decreasing, and where does it change direction)?
We already know that the first derivative will tell us whenever f(x) is increasing or decreasing: If f '(x) is positive, this means that by definition, the rate of change of f(x) is positive, or f(x) is increasing from left to right. Similarly, if f '(x) is negative, f(x) is decreasing from left to right.
So the only question remaining to answer here is, "How do we identify the exact place where f(x) changes direction (from increasing to decreasing, or from decreasing to increasing)? These places must either be points of discontinuity (a break in the graph), or a local maximum or minimum, because there is no other way for the graph to change direction. So, if we can find all the points at which f(x) has a discontinuity, and all the points at which f(x) could possibly have a local maximum or minimum, then for each of the intervals between these "critical points" it would be clear that the function is either increasing or decreasing on that whole interval (it can't change directions inside an interval where there is no break in the graph and no max or min). (For a more formal discussion of why this is true, take a look at this page.)
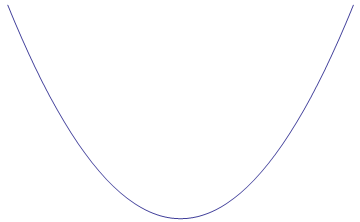
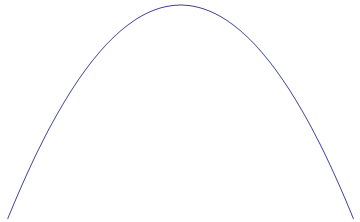
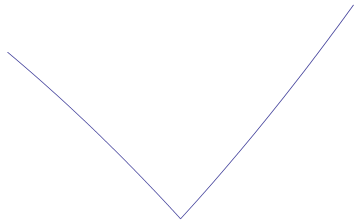
We know already how to find any places where f(x) is discontinuous. So how do we find relative minimums and maximums? To answer this question, let's first think about all the possible ways that local minimums and maximums could appear. The could either be smooth and continuous, like in the first row of the table below, or they could be sharp with a sudden turn in direction, like in the second row in the table below:
| Local Minimums | Local Maximums |
|---|---|
 |
 |
 |
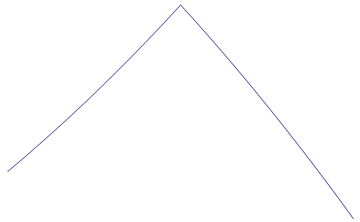 |
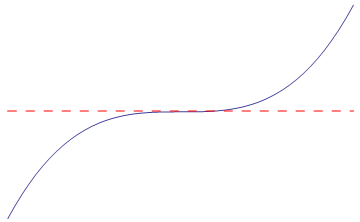
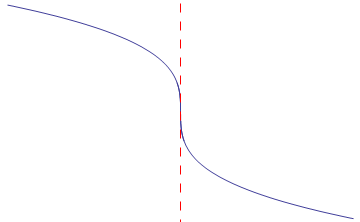
If we think about this carefully, we will see that a relative minimum or maximum can only occur when the original function f(x) is continuous around that point (the original function has to exist in order for there to be a min or a max) and when the derivative f '(x) is either equal to zero (smooth max/min) or undefined (e.g. cusp as max/min). So if we can find all the places that f '(x) is either zero or undefined (but f(x) is NOT undefined), we can test each point to see if it is a maximum or minimum. Let's call these points where we have potential maximums and minimums critical points (because they represent points where "something interesting" could potentially be happening).
There may be places where the derivative is zero or undefined that are not maximums or minimums, so we need to check each critical point to see if any or all of them are local maximums or minimums. For example,
| f'(x)=0, but not a local max/min | f'(x) is undefined, but not a local max/min |
|---|---|
 |
 |
So, how do we test each critical point to see if it is a local max/min? Here is one option:
-
We can look at the behavior just to the left and just to the right of each critical point: if f(x) is decreasing (i.e. f '(x) is negative) just to the left and then f(x) is increasing (i.e. f '(x) is positive) just to the right, then the critical point must be a local minimum. Similarly, if f(x) is increasing (i.e. f '(x) is positive) just to the left and then f(x) is decreasing (i.e. f '(x) is negative) just to the right, then the critical point must be a local maximum. If we don't have one of these two patterns (e.g. if f(x) is increasing both to the left and the right, or decreasing both to the left and to the right), then the critical point cannot be a maximum or minimum. So to check whether a critical point is a local max/min, we need only check if f '(x) is positive or negative in the interval to the left and to the right of the critical point, which we can do by simply selecting some number in each interval and testing to see if the derivative is positive or negative for each of those values.
There are deeper reasons why we can assume that this will work - it seems like common sense, but there are actually some mathematical conditions that we should check. You can read more about the details of this here.
Where is the curve curving upward or curving downward?
To answer this question, let's first formally define what we mean. We call a section of a curve concave up if the concave side of the curve is facing upward, and we call it concave down if the concave side is facing downward, as we see in the images below:
| concave up | concave down |
|---|---|
 |
 |
It turns out that the second derivative will be able to tell us something about the way a function curves: The second derivative is the derivative of the derivative, so it tells us about the rate of change of the derivative itself. If the derivative is increasing, the second derivative should be positive, and if the derivative is decreasing, then the second derivative should be negative.
If we look at the graph of a curve that is concave up, we can see that the derivative, or slope, must be increasing everywhere on this curve: on the left half of the curve, the slope is negative and getting less steep (or less negative) and is therefore increasing; on the right half of the curve, the slope is positive and getting steeper, and is therefore increasing. Similarly, if we look at the graph of a curve that is concave down, we can see that the derivative, or slope, must be decreasing everywhere on this curve: on the left half of the curve, the slope is positive and getting less steep and is therefore decreasing; on the right half of the curve, the slope is negative and getting steeper (or more negative) and is therefore decreasing. So anywhere that f(x) is concave down, f ''(x) must be negative, and anywhere that f(x) is concave up, f ''(x) must be positive.
The places where a curve switches from concave up to concave down or vice versa is called an inflection point. If we think about it, a curve could not switch from concave up to concave down or vice versa unless the second derivative momentarily passed through zero, or unless the second derivative was undefined. So all the inflection points of f(x) must be in places where f ''(x) is either undefined or equal to zero. So we can list all the potential inflection points by finding all the places where f ''(x) is either undefined or equal to zero, and then we just need to test each one to see if it is an actual inflection point.
To test it, all we need to do is to check whether the function on either side of that potential inflection point is concave up or concave down: so all we need to do is to check if f ''(x) is positive or negative in the interval to the left and to the right of the potential inflection point, which we can do by simply selecting some number in each interval and testing to see if the second derivative is positive or negative for each of those values.